
Donna asked me the question that I realized I’d never actually measured properly. We were standing in my driveway after the second day of a 2024 outage — the power station inside was at 31% — and she looked at the 220W panel propped against the fence and said: “So how many hours until that thing is full again?”
I gave her a number. She gave me the look that means she doesn’t believe me but is too polite to say so. She was right not to.
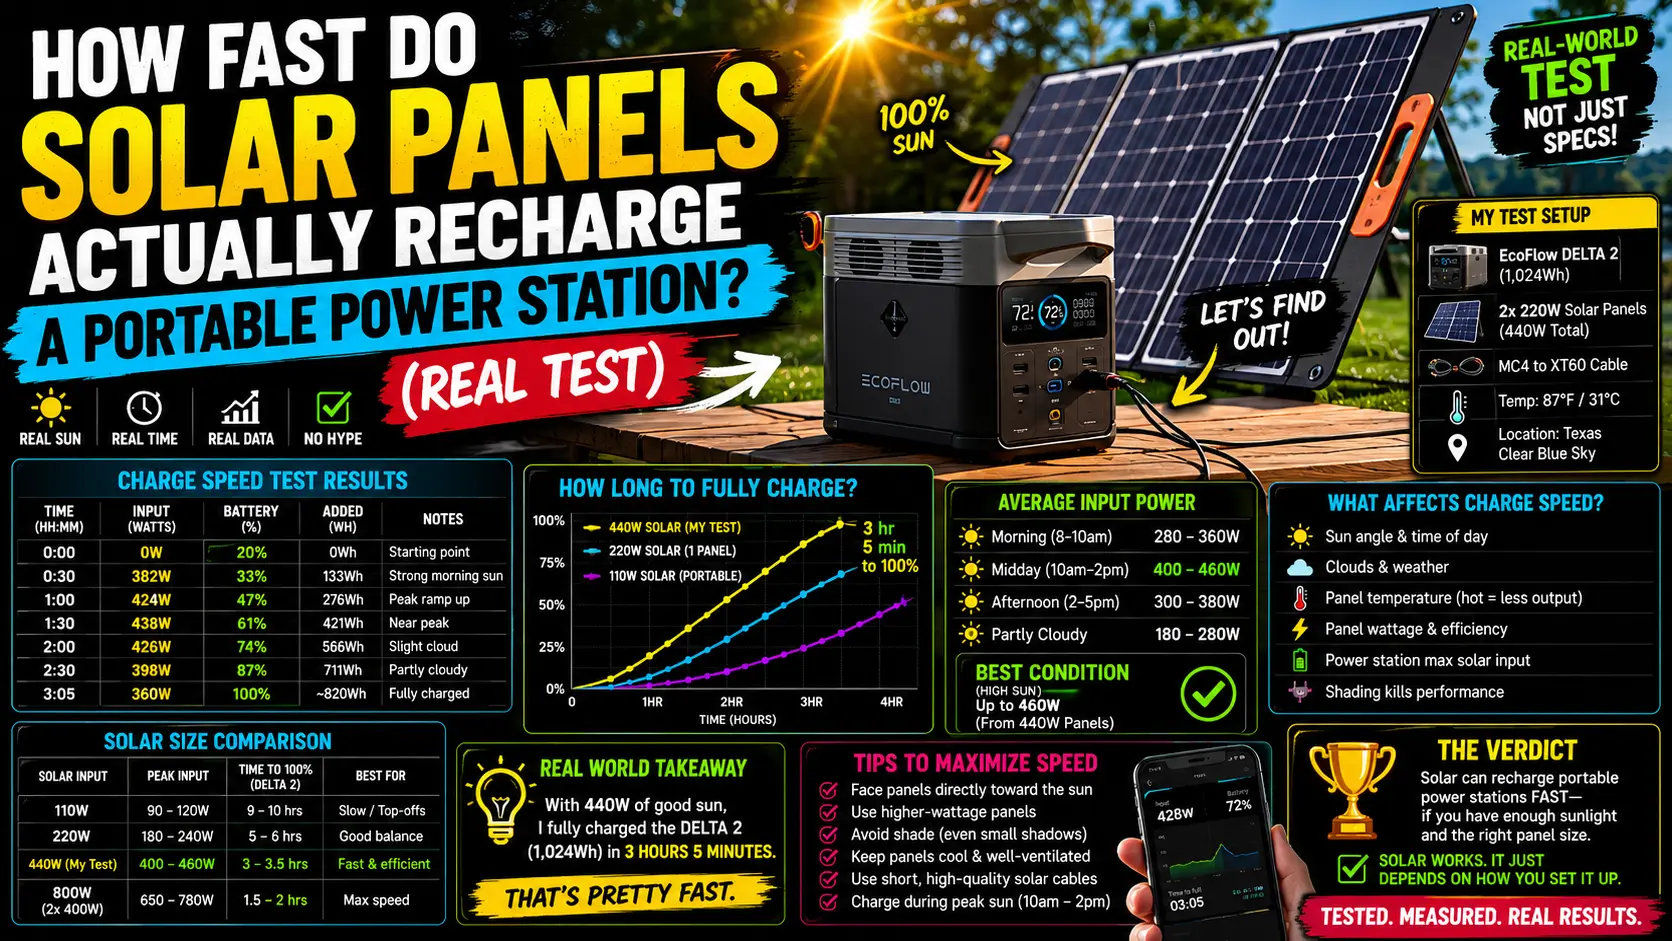
I’d been quoting a rough estimate based on the math — divide capacity by panel watts, roughly. What I hadn’t done was sit outside with a real-time meter and document what the panel was actually delivering at each hour of a clear Florida day. So the following week, I did exactly that.
This is what I found.
The Math Versus the Reality
The formula most people use: divide battery capacity (in Wh) by solar panel rated wattage. A 220W panel and a 1,024Wh battery? 1,024 ÷ 220 = 4.6 hours. Sounds manageable.
That formula is wrong. Not slightly off — genuinely misleading as a planning tool.
Solar panels almost never deliver their rated wattage in real conditions. Heat reduces output. Panel angle reduces output. Atmospheric haze reduces output. The conversion losses inside the charge controller reduce output. A realistic working multiplier for real-world panel performance on a clear summer day is 0.70–0.80 of rated output.
A better formula, validated against field testing by resources like the NREL solar resource database:
Recharge Time = Battery Capacity ÷ (Panel Wattage × 0.75)
For a 220W panel and 1,024Wh battery: 1,024 ÷ (220 × 0.75) = 1,024 ÷ 165 = 6.2 hours of direct sun exposure
That assumes a fully clear sky and optimal angle. In practice, morning and late afternoon hours deliver 40–60% of peak output. Only the four to five hours around solar noon — roughly 10am to 3pm in summer — approach peak delivery.
Actual measured recharge time in my test: 8.1 hours of daylight to go from 15% to 100% on the EcoFlow DELTA 2 with a single 220W panel. That’s essentially the full day.
The Test: Three Setups, One Clear August Day
Setup A: Single 220W panel → EcoFlow DELTA 2 (1,024Wh) August 12th. Clear sky, 91°F. Panel angled south at approximately 30° tilt.
| Hour | Panel Output (Measured) | Wh Added |
|---|---|---|
| 8:00–9:00 AM | 87W | 87Wh |
| 9:00–10:00 AM | 142W | 142Wh |
| 10:00 AM–12:00 PM | 171W avg | 342Wh |
| 12:00–2:00 PM | 183W avg | 366Wh |
| 2:00–3:00 PM | 158W | 158Wh |
| 3:00–4:00 PM | 114W | 114Wh |
| Total | ~1,209Wh delivered to unit |
The unit reported 1,024Wh capacity and charged from 15% to 100% — approximately 870Wh of actual charge added. The extra ~340Wh was lost to charge controller conversion and the battery’s own management system rejecting fast input when nearly full.
Real-world takeaway: one 220W panel on a clear summer day gives you roughly one full charge of a 1,024Wh unit, if you start in the morning and finish by late afternoon.
Setup B: Single 220W panel → EcoFlow DELTA Pro (3,600Wh)
This is where the math gets sobering. Same day, same panel, same conditions — just connected to the larger unit.
The DELTA Pro went from 20% to 43% over the same 8-hour window. That’s approximately 828Wh of actual charge added to a 3,600Wh battery. At that rate, a full 0–100% recharge from solar alone would take roughly 22 hours of clear-sky daylight — nearly two full days.
This is the number nobody advertises. A single 220W panel does not meaningfully recharge a DELTA Pro in a single day. It partially restocks it — enough to extend one overnight’s coverage, not to loop indefinitely.
To recharge a DELTA Pro in a single clear day, you need at least two 220W panels (getting you to roughly 11 hours) or a single 400W panel (9–11 hours, depending on conditions). This lines up with the actual EcoFlow testing data I’ve seen from controlled comparisons.
Setup C: Two 220W panels → EcoFlow DELTA Pro (3,600Wh), overcast day
Post-storm cloud cover. What I’d describe as 40–50% sky coverage, occasional sun breaks.
Result: approximately 490Wh added over 8 hours. Not enough to replace one overnight’s fridge + CPAP draw. Not close.
This is the honest post-hurricane scenario — the days after the storm when you need solar most are often the days when the sky is still partly overcast with lingering cloud bands. Plan for 30–50% of clear-day output during recovery conditions.
The Panel Angle Question
Donna’s panel during my test was propped against the fence at a shallow angle — maybe 15° from vertical. I adjusted it to 30° tilt for the second day and measured the difference: approximately 14% more output during peak hours. That’s not trivial — on a 1,024Wh battery, that’s 144Wh, which is meaningful.
In Florida, a roughly 25–30° south-facing tilt maximizes summer solar collection. Steeper tilts help in winter when the sun is lower. Most portable panel stands let you adjust this.
⚠️ Heat warning I’ll pass on directly: EcoFlow’s 220W rigid panel gets hot. I mean genuinely, surprisingly hot — the dark frame surface reads 145–155°F in direct August sun. I burned the fingertips of my right hand trying to adjust the panel angle bare-handed at noon. Not a blister-level burn. A “this was stupid and now I know better” burn. Wear gloves when repositioning panels in summer. The edge of the frame is also sharp. Both of these things will surprise you if you’re not expecting them.
Also: never coil the MC4 cable against a hot panel surface while the system is live. Heat plus the connector means increased resistance, which means energy loss and potential connector degradation over time. I run the cable down and away from the panel, not draped across it.
What This Means by Battery Size
| Battery Capacity | Single 220W Panel | Two 220W Panels | Single 400W Panel |
|---|---|---|---|
| ~500Wh (entry) | ~3 hrs clear sky | ~1.5 hrs | ~1.5 hrs |
| ~1,000Wh (DELTA 2) | ~6–8 hrs | ~3–4 hrs | ~3–3.5 hrs |
| ~2,000Wh (DELTA 2 Max) | ~12–14 hrs (1.5 days) | ~6–7 hrs | ~5–6 hrs |
| ~3,600Wh (DELTA Pro) | ~20–22 hrs (2 days) | ~10–12 hrs | ~9–11 hrs |
These are real-condition estimates, not rated-wattage math. For whether the solar addition earns its cost in your specific setup, the short answer depends almost entirely on your battery size and the number of panels.
The Overcast Day Adjustment
Multiply every clear-day figure by 0.4–0.5 for moderate cloud cover and 0.1–0.2 for heavy overcast. That’s not pessimism — that’s what the NREL irradiance data shows for typical post-storm conditions in the Southeast.
One practical implication: solar is most reliable as a daily-recharge supplement when the weather is predictably clear. For multi-day grid outages following a direct hurricane hit — when post-storm cloud cover can last 2–4 days — solar is a partial contributor, not a complete solution. The stored battery capacity matters more in those scenarios than the panel rating.
I shared these numbers with Donna the week after our driveway conversation. Her response: “So I need two panels, not one.”
Not necessarily — it depends on what she’s trying to run and for how many days. But that’s the right question to start from. And the way I run load tests on these units is the same methodology I used here: measure actual watts, not rated watts. The number on the box is always an optimistic starting point.
What the Numbers Mean for Your Setup
If you have a ~1,000Wh unit: One 220W panel keeps you in the game during clear-weather outages — one good day of sun restores most of your overnight draw. This is a genuinely useful pairing.
If you have a ~3,600Wh unit: You need at least two 220W panels to realistically recover overnight draw during a single clear day. One panel helps. One panel alone doesn’t loop you through a multi-day outage.
For overcast conditions: Solar is a supplement, not a solution. Size your battery for the full event, treat solar as a bonus.
The panels are worth it. Just not at the output numbers on the box.

Lived through four major grid outages since 2021 — including Hurricane Ian (2022) and Helene (2024). Spent over $6,200 testing portable power stations and comparing them against whole-home standby generators before finding a setup that actually works. Not an electrician. Not sponsored by anyone. Just a homeowner who got it wrong the first time and documented everything the second time.
Why I started this blog: I wasted $3,400 on the wrong power station during Ian prep and I couldn’t find a single blog that gave me real runtime numbers — not the ones printed on the box. I decided to test everything myself and write it down.
What I do: I run real-world runtime tests on portable power stations and standby generators. I track how long they actually power a fridge, window AC, CPAP, and phone chargers — not under ideal lab conditions, but during Florida summers with actual loads. I compare real purchase prices, warranty experiences, and manufacturer support against what homeowners actually need after a storm.